


Want More Effective Packaging Designs?
Start With Strategy.
Sabrina Pfautz is a Partner and Creative Director at Aid&Abet, a strategic branding and marketing agency focused solely on food & beverage and natural product brands. Sabrina’s recent work includes strategy and creative direction for national brands like Love Beets, BrightFarms, Campbell’s, and Organicgirl.
When you’re designing packaging for a product, you’re designing an experience for your brand. Because every customer interaction with that brand is so precious, it can be tempting to include every feature, benefit, certification, and accolade about your product on the label.
Yet, if you try to say everything about your products through your package design, you’ll end up communicating nothing. There’s a better way. And it starts with identifying an “ownable” white space for your brand.
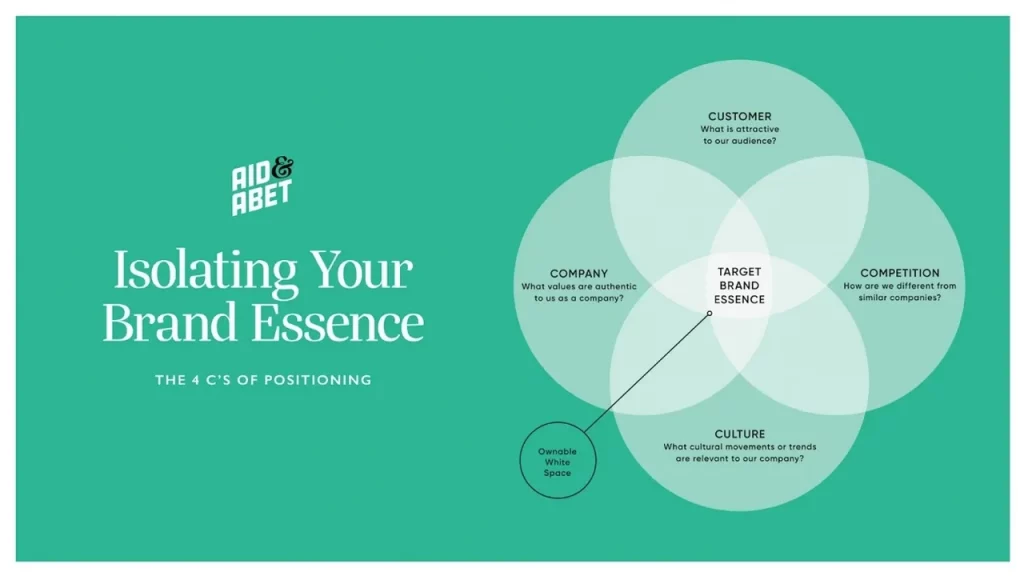
For a stronger package design, nail your brand essence first.
The most compelling presentation of your product lives at the intersection of what we call “The 4 C’s”:
- Company – what values are unique to your organization?
- Customer – what is attractive to your audience?
- Competition – what separates you from the competition?
- Culture – what cultural movements are relevant to your brand or product?
Identifying Your Target Customer
Often, you’ll hear a company call out “Millennials” or “Gen Z” as their target demographic. But is this enough?
Investors are going to want to know more about your target consumer than just their generation, and they’re going to want to make sure that you have a deeper understanding of your audience. Is there a certain segment of Millennials that you are targeting? The more you nail it down, the more impactful your data gets.
Once you’ve nailed down your target demographic, use data to focus on their preferences and behavior. Are you currently reaching your target consumer, or is your strategy too broad? Lululemon’s success, for instance, came from initially targeting a hyper-specific market. Once they saw success and began to have a grasp on their initial target customer, they were able to expand to menswear and kids.
Ensure that your growth strategy aligns with your target audience. Your product should have the right labeling, claims, and certifications to resonate with them. You also need to continuously measure your progress and adapt to demographic shifts and market trends.
What is the Size of Your Market / Opportunity?
Use data to identify the size of your market and opportunities. Understand which channels are driving growth and which retailers have the most impact on your target demographic. Consider regional strategies; sometimes, dominating a specific area before expanding can be more effective. It’s easy to take any and all distribution that you are offered, but if your target demographic doesn’t resonate with the retailers or region, your success will be limited.
Additionally, you should examine your competitive set. This can help you to set benchmarks for your growth. How are they performing? How did they make their way into the market? What mistakes have they made that you can learn from?
In summary, to understand the size of the market and help investors understand, you’ll want to:
- Highlight your strategy through the lens of that total addressable market and your pathway to get there.
- Understand the distribution and velocity growth you need to meet your proposed targets and communicate your strategy.
- Highlight specific areas of opportunity to focus on for the future.
What Makes You Different?
Your uniqueness sets you apart. How does your uniqueness fit into your mission? How does it resonate with your target consumer? You’ll want to call out these attributes that make you unique in the market. But it’s more than just calling them out. You’ll want to use data to help emphasize what makes your product unique and on-trend. Do you have any special certifications? Any claims? Different flavors? Does your packaging and positioning highlight these differences in your product?
Once you’ve identified what attributes truly make you different or resonate most with your target consumers, you can dig into the performance of each. Do you understand the trend lines and how your product is aligning? Is it on trend, or is it outperforming? Leverage data to dive deep into product coding to create insights regarding certifications and claims, demonstrating your commitment to trends and innovation.
Proof of Traction
Demonstrating momentum in the marketplace is crucial. Using data to highlight metrics like revenue and unit growth, household penetration, new retail partners, social media following, velocity growth, and distribution growth will help quantify your growth for investors. The more you can highlight that your product is catching fire, the better! Although showing proof of growth is imperative, it’s equally important to show a plan to keep the momentum going.
If you encounter challenges, consider connecting with someone at NIQ to help you uncover your best-selling points.
Forecasts, Benchmarks, and ROI
How do you start to communicate that your company is worth investing in? This is a big piece of the puzzle and is typically very data heavy. A great place to start is creating robust forecasts and benchmarks to show you have growth plans and you know how to get there. Identify proxy brands and examine their trajectory over five years with granular data on metrics like %ACV, %TDP, store counts, and velocity. What was their path to where they are now? Use this data to show whether you are on pace to meet your targets and, if not, your plan of action.
Understanding distribution is crucial to use velocity effectively. It is more than just store/door counts. Measure your brand’s distribution through metrics like %ACV and TDP to gauge your reach and influence.
- %ACV (%All Commodity Volume) is a distribution metric that uses a weighted distribution methodology that gives different weights to stores based on how much volume a store does. The more volume a store does, the more distribution weighting it receives. %ACV measures the total retail volume the stores that your brands are distributed in represent
- TDP: A reference point for how broadly a specific brand is distributed, calculated by totaling the %ACV for each item.
- For example, if your brand has 3 SKUs, and SKU #1 has a %ACV of 50%, SKU #2 has a %ACV of 20%, and SKU #3 has a %ACV of 70%, the Total Distribution Points (TDP) for the brand would be the sum of all %ACV, 140%
Finally, provide a clear picture of how you intend to allocate investment funds, their impact on forecasts and benchmarks, and your exit strategy. Where will you spend their money? What impact will an investment have on the forecasts and benchmarks? What is the exit strategy?
Data-driven investor decks are essential for attracting capital investments. By using data effectively to address these key questions, your investor presentation will be more compelling, demonstrating your company’s mission, target audience, market size, uniqueness, traction, and forecasts. Remember, it’s not just about the data; it’s about how you leverage it to tell a convincing story and guide your strategic decisions.
As a member of Startup CPG, you can access an exclusive offer: a complimentary Byzzer account and three free reports. Don’t miss this opportunity to leverage the power of data and enhance your investor pitch. Access now or schedule a free 1:1 consultation to take your brand to the next level with Byzzer!

All Comments